SuiteBiz
SuiteBiz
SuiteBiz
Operations & Performance Dashboard for Companies
Project Type: SAAS B2B Dashboard Platform
My Role: Lead Product Designer (UX/UI, Research, Testing, Interaction Design)
Operations & Performance Dashboard for Companies
Project Type: SAAS B2B Dashboard Platform
Role: Lead Product Designer (UX/UI, Research, Testing, Interaction Design)
Operations & Performance Dashboard for Companies
Project Type: SAAS B2B Dashboard Platform
My Role: Lead Product Designer (UX/UI, Research, Testing, Interaction Design)
SaaS / B2B
SaaS / B2B
SaaS / B2B
Dashboard Platform
Dashboard Platform
Dashboard Platform
2024
2024
2024
Overview
Overview
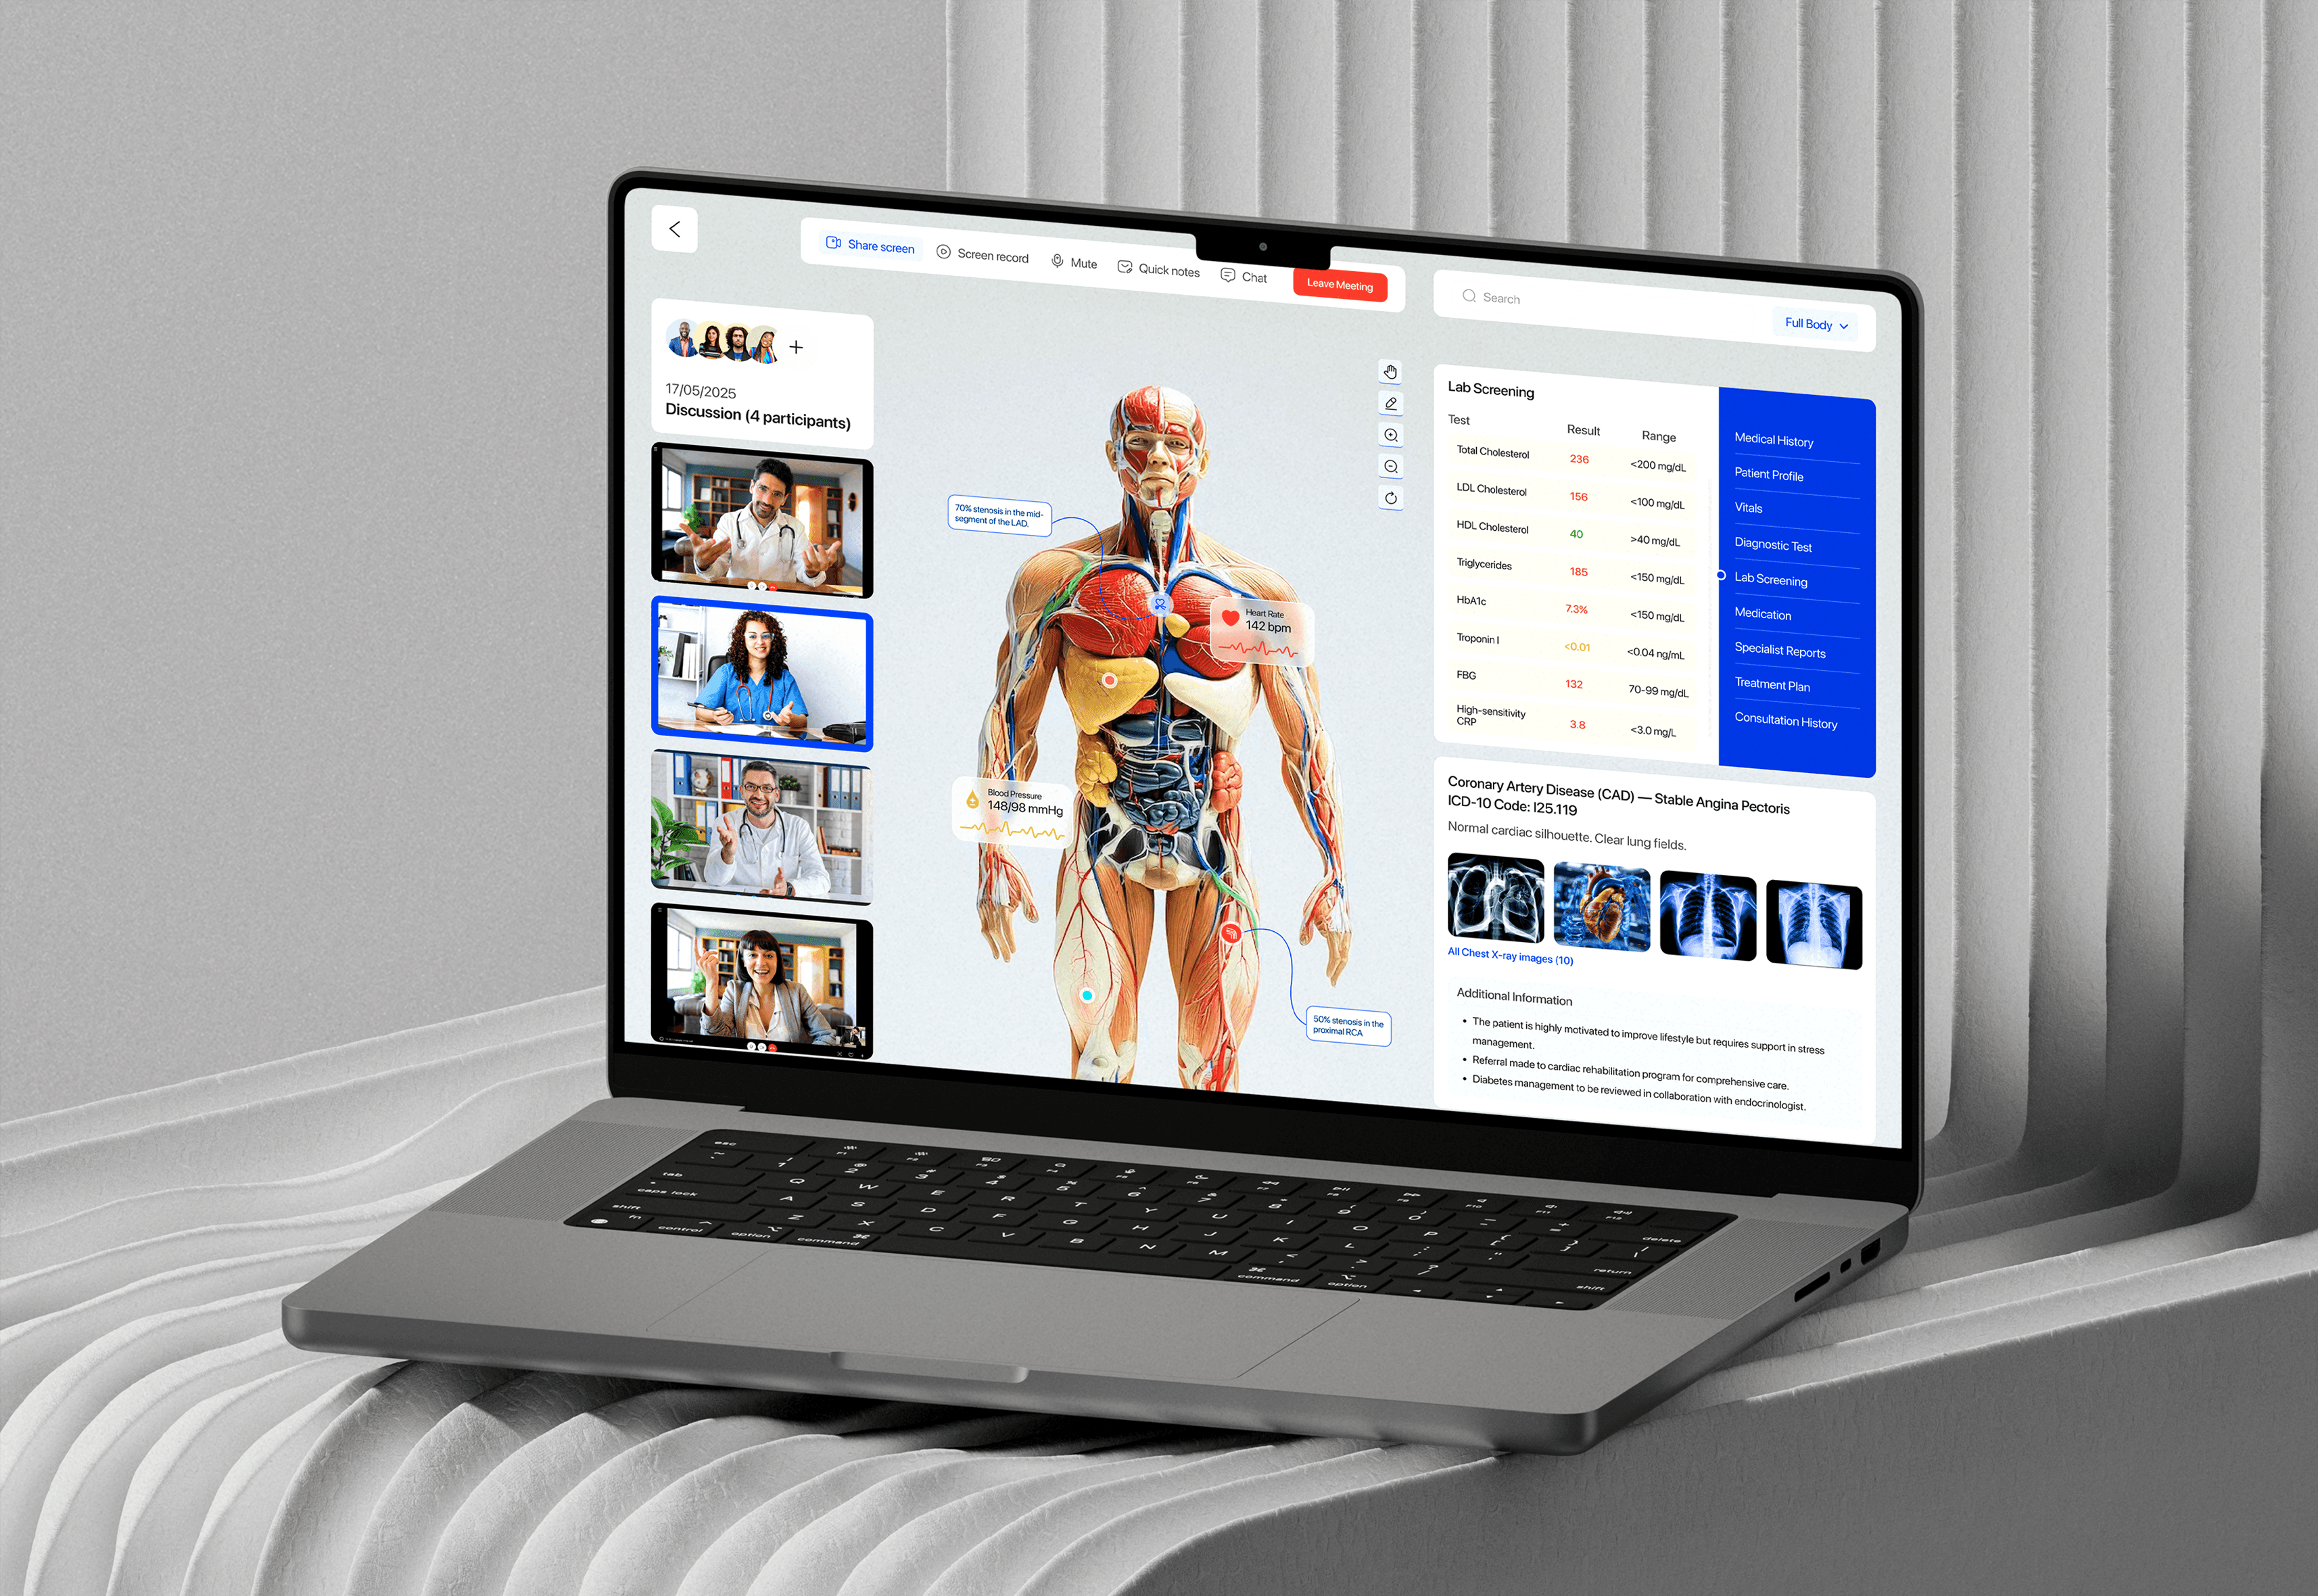
BizPulse is a SaaS platform that helps companies track key operational metrics, visualize performance data, and monitor progress toward internal KPIs and business goals. It serves as a centralized business dashboard—perfect for management teams to align strategy, spot inefficiencies, and make smarter, faster decisions.
BizPulse is a SaaS platform that helps companies track key operational metrics, visualize performance data, and monitor progress toward internal KPIs and business goals. It serves as a centralized business dashboard—perfect for management teams to align strategy, spot inefficiencies, and make smarter, faster decisions.
Challenge
Challenge
Many companies rely on fragmented tools (spreadsheets, siloed dashboards, manual reporting) to track operations, making it difficult to:
Get a real-time snapshot of performance
Identify underperforming departments early
Align cross-functional teams toward shared KPIs
This disjointed system slows down decision-making, causes missed opportunities, and contributes to operational inefficiencies.
Design Decisions Aligned With Business Goals
Design Decisions Aligned With Business Goals
Live Data Sync → Saves time and eliminates manual updates, improving operational efficiency.
Goal & KPI Tracker → Encourages teams to stay aligned with targets, driving productivity and accountability.
Smart Alerts → Reduces business risk by catching issues early, minimizing losses or delays.
Visual Insights → Supports executive decisions with clear, digestible data.
Team Insights Panel → Encourages ownership and performance transparency.
Strategy Snapshot → Keeps leadership focused on long-term outcomes, not just daily numbers.
Primary Outcome
Primary Outcome
The platform helped reduce reporting time by 30%, improved cross-team visibility, and increased KPI achievement rate by 19% in pilot companies over 3 months..
The platform helped reduce reporting time by 30%, improved cross-team visibility, and increased KPI achievement rate by 19% in pilot companies over 3 months..
DESIGNS
DESIGNS
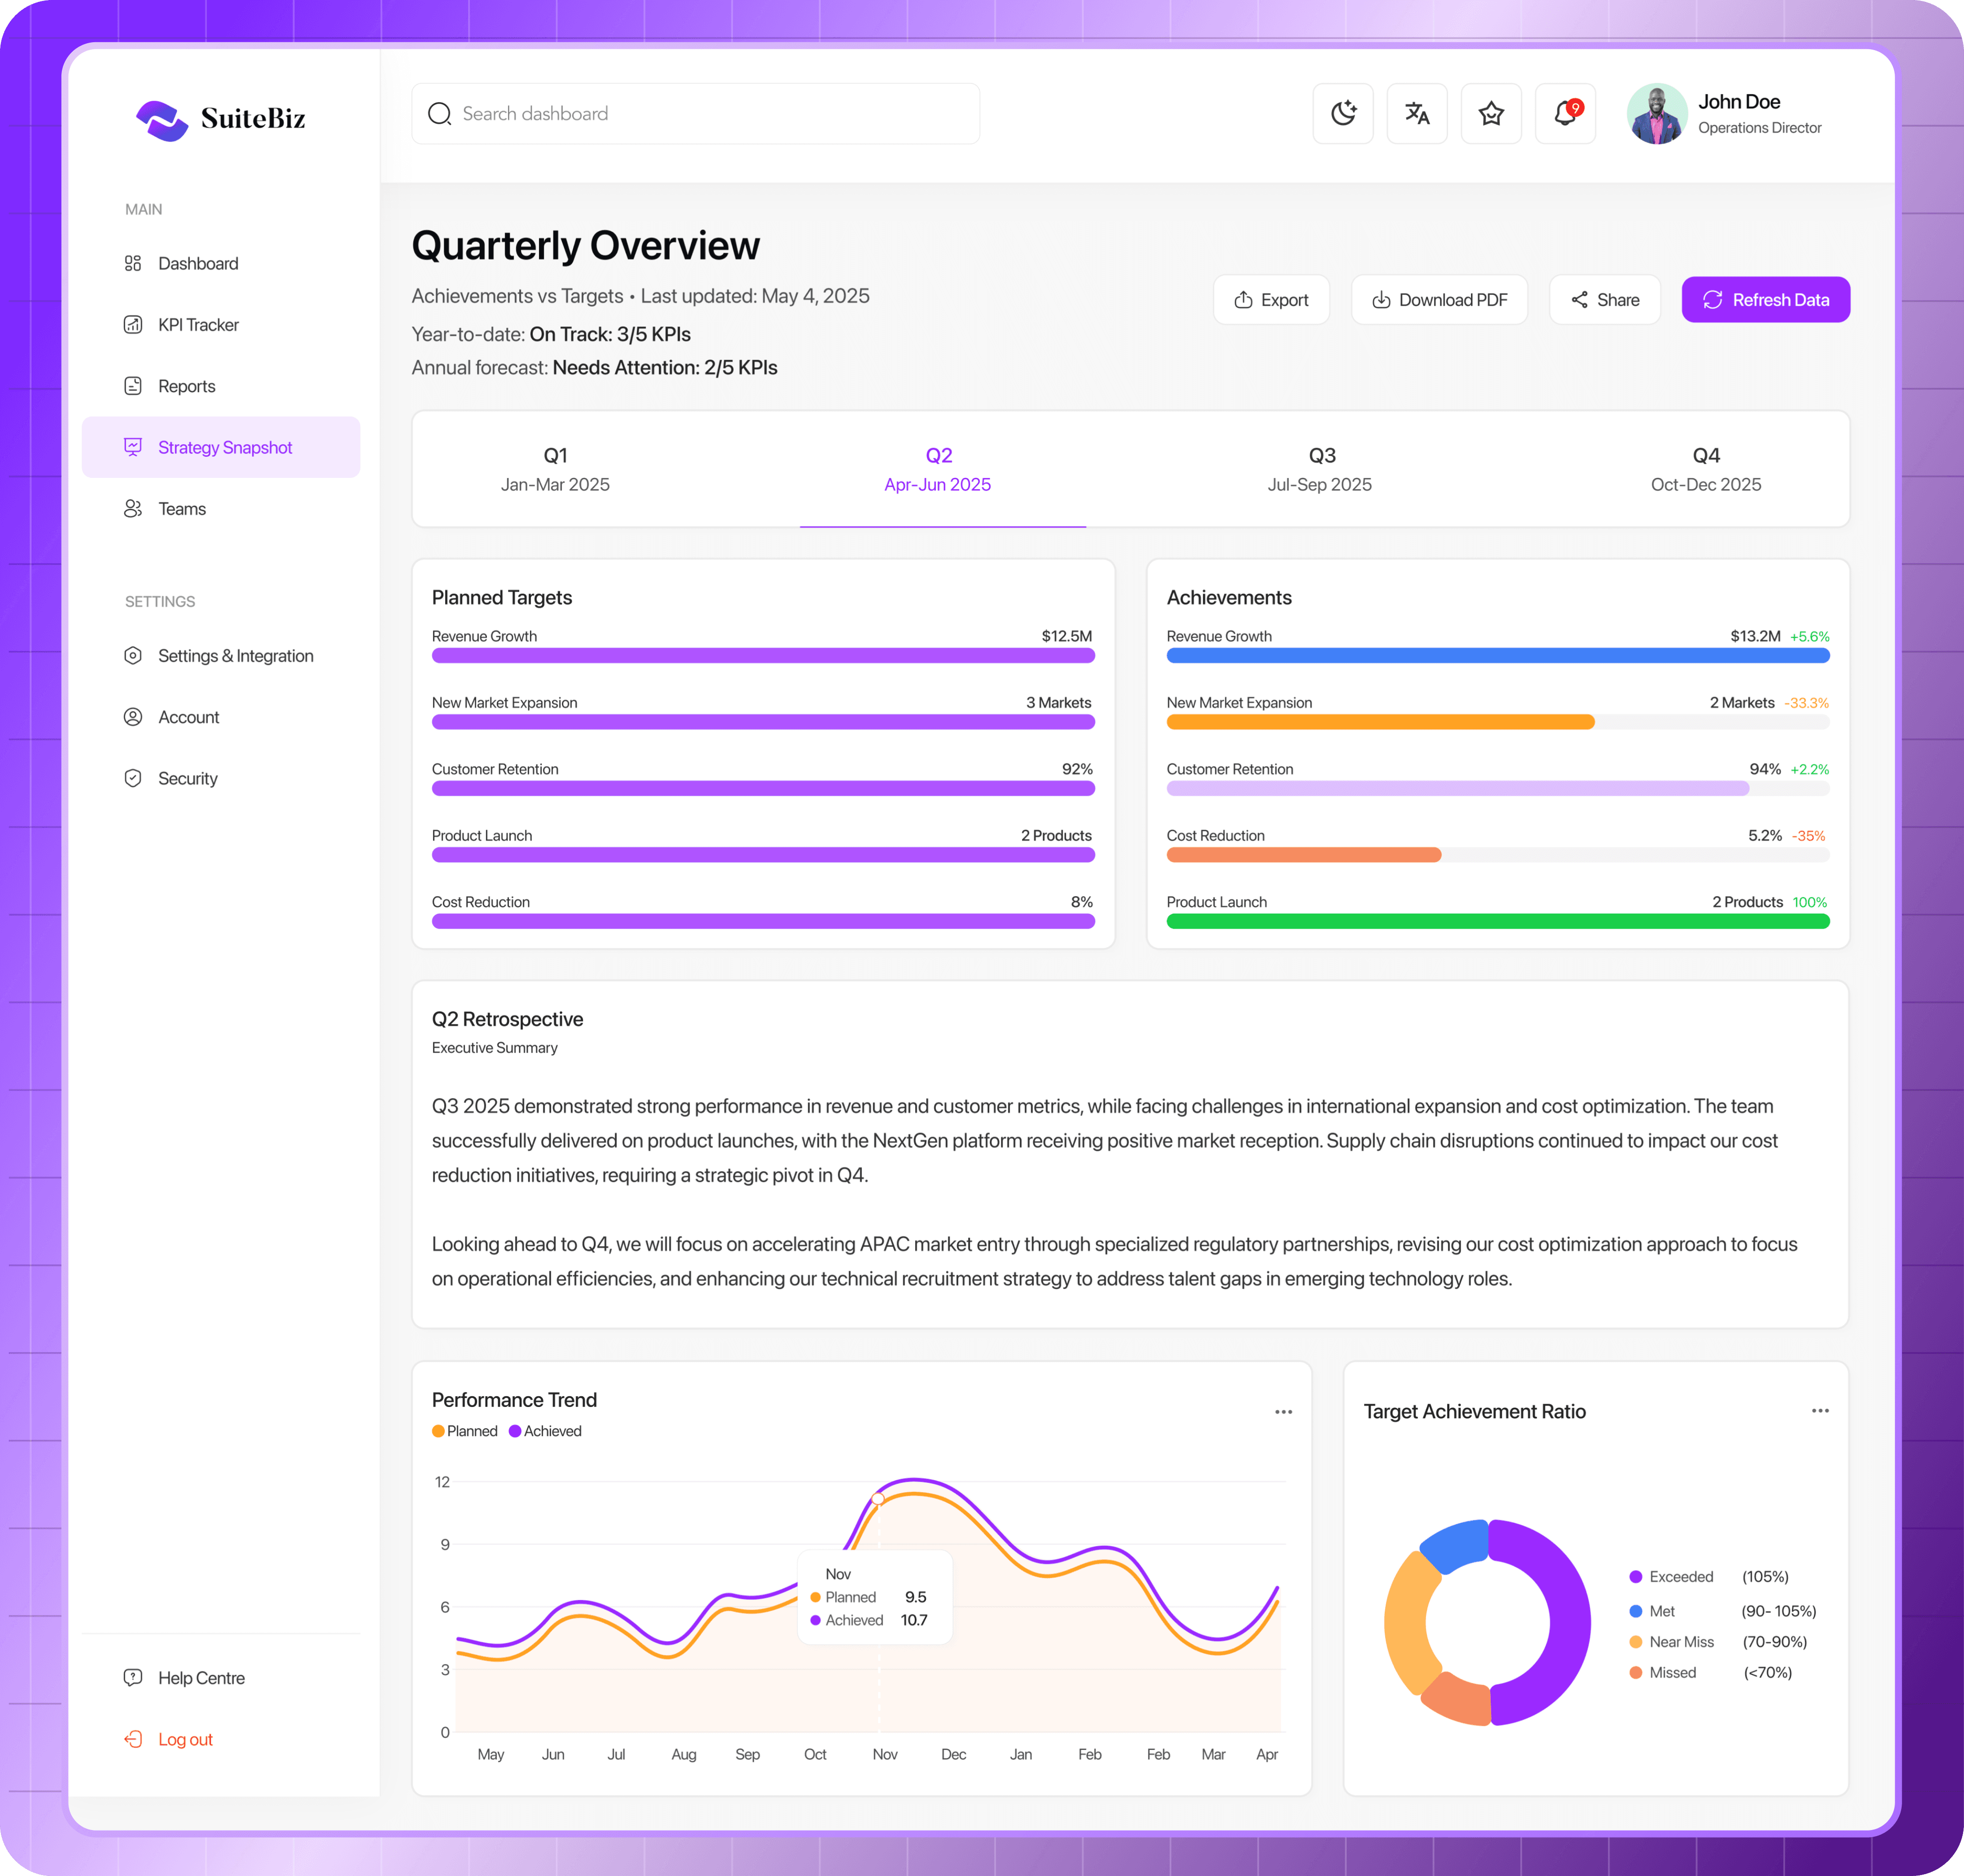
Strategy Snapshot
Strategy Snapshot
What it does:
Visual quarterly view comparing actual progress vs strategic goals. Uses charts and milestone markers to show alignment or deviation.
User Value:
Gives leadership a bird’s-eye view of whether their teams are on pace to meet long-term objectives.
Outcome:
Keeps executives focused on results, not just daily operations — which supports consistent growth and investor confidence.
What it does:
Visual quarterly view comparing actual progress vs strategic goals. Uses charts and milestone markers to show alignment or deviation.
User Value:
Gives leadership a bird’s-eye view of whether their teams are on pace to meet long-term objectives.
Outcome
Keeps executives focused on results, not just daily operations — which supports consistent growth and investor confidence.
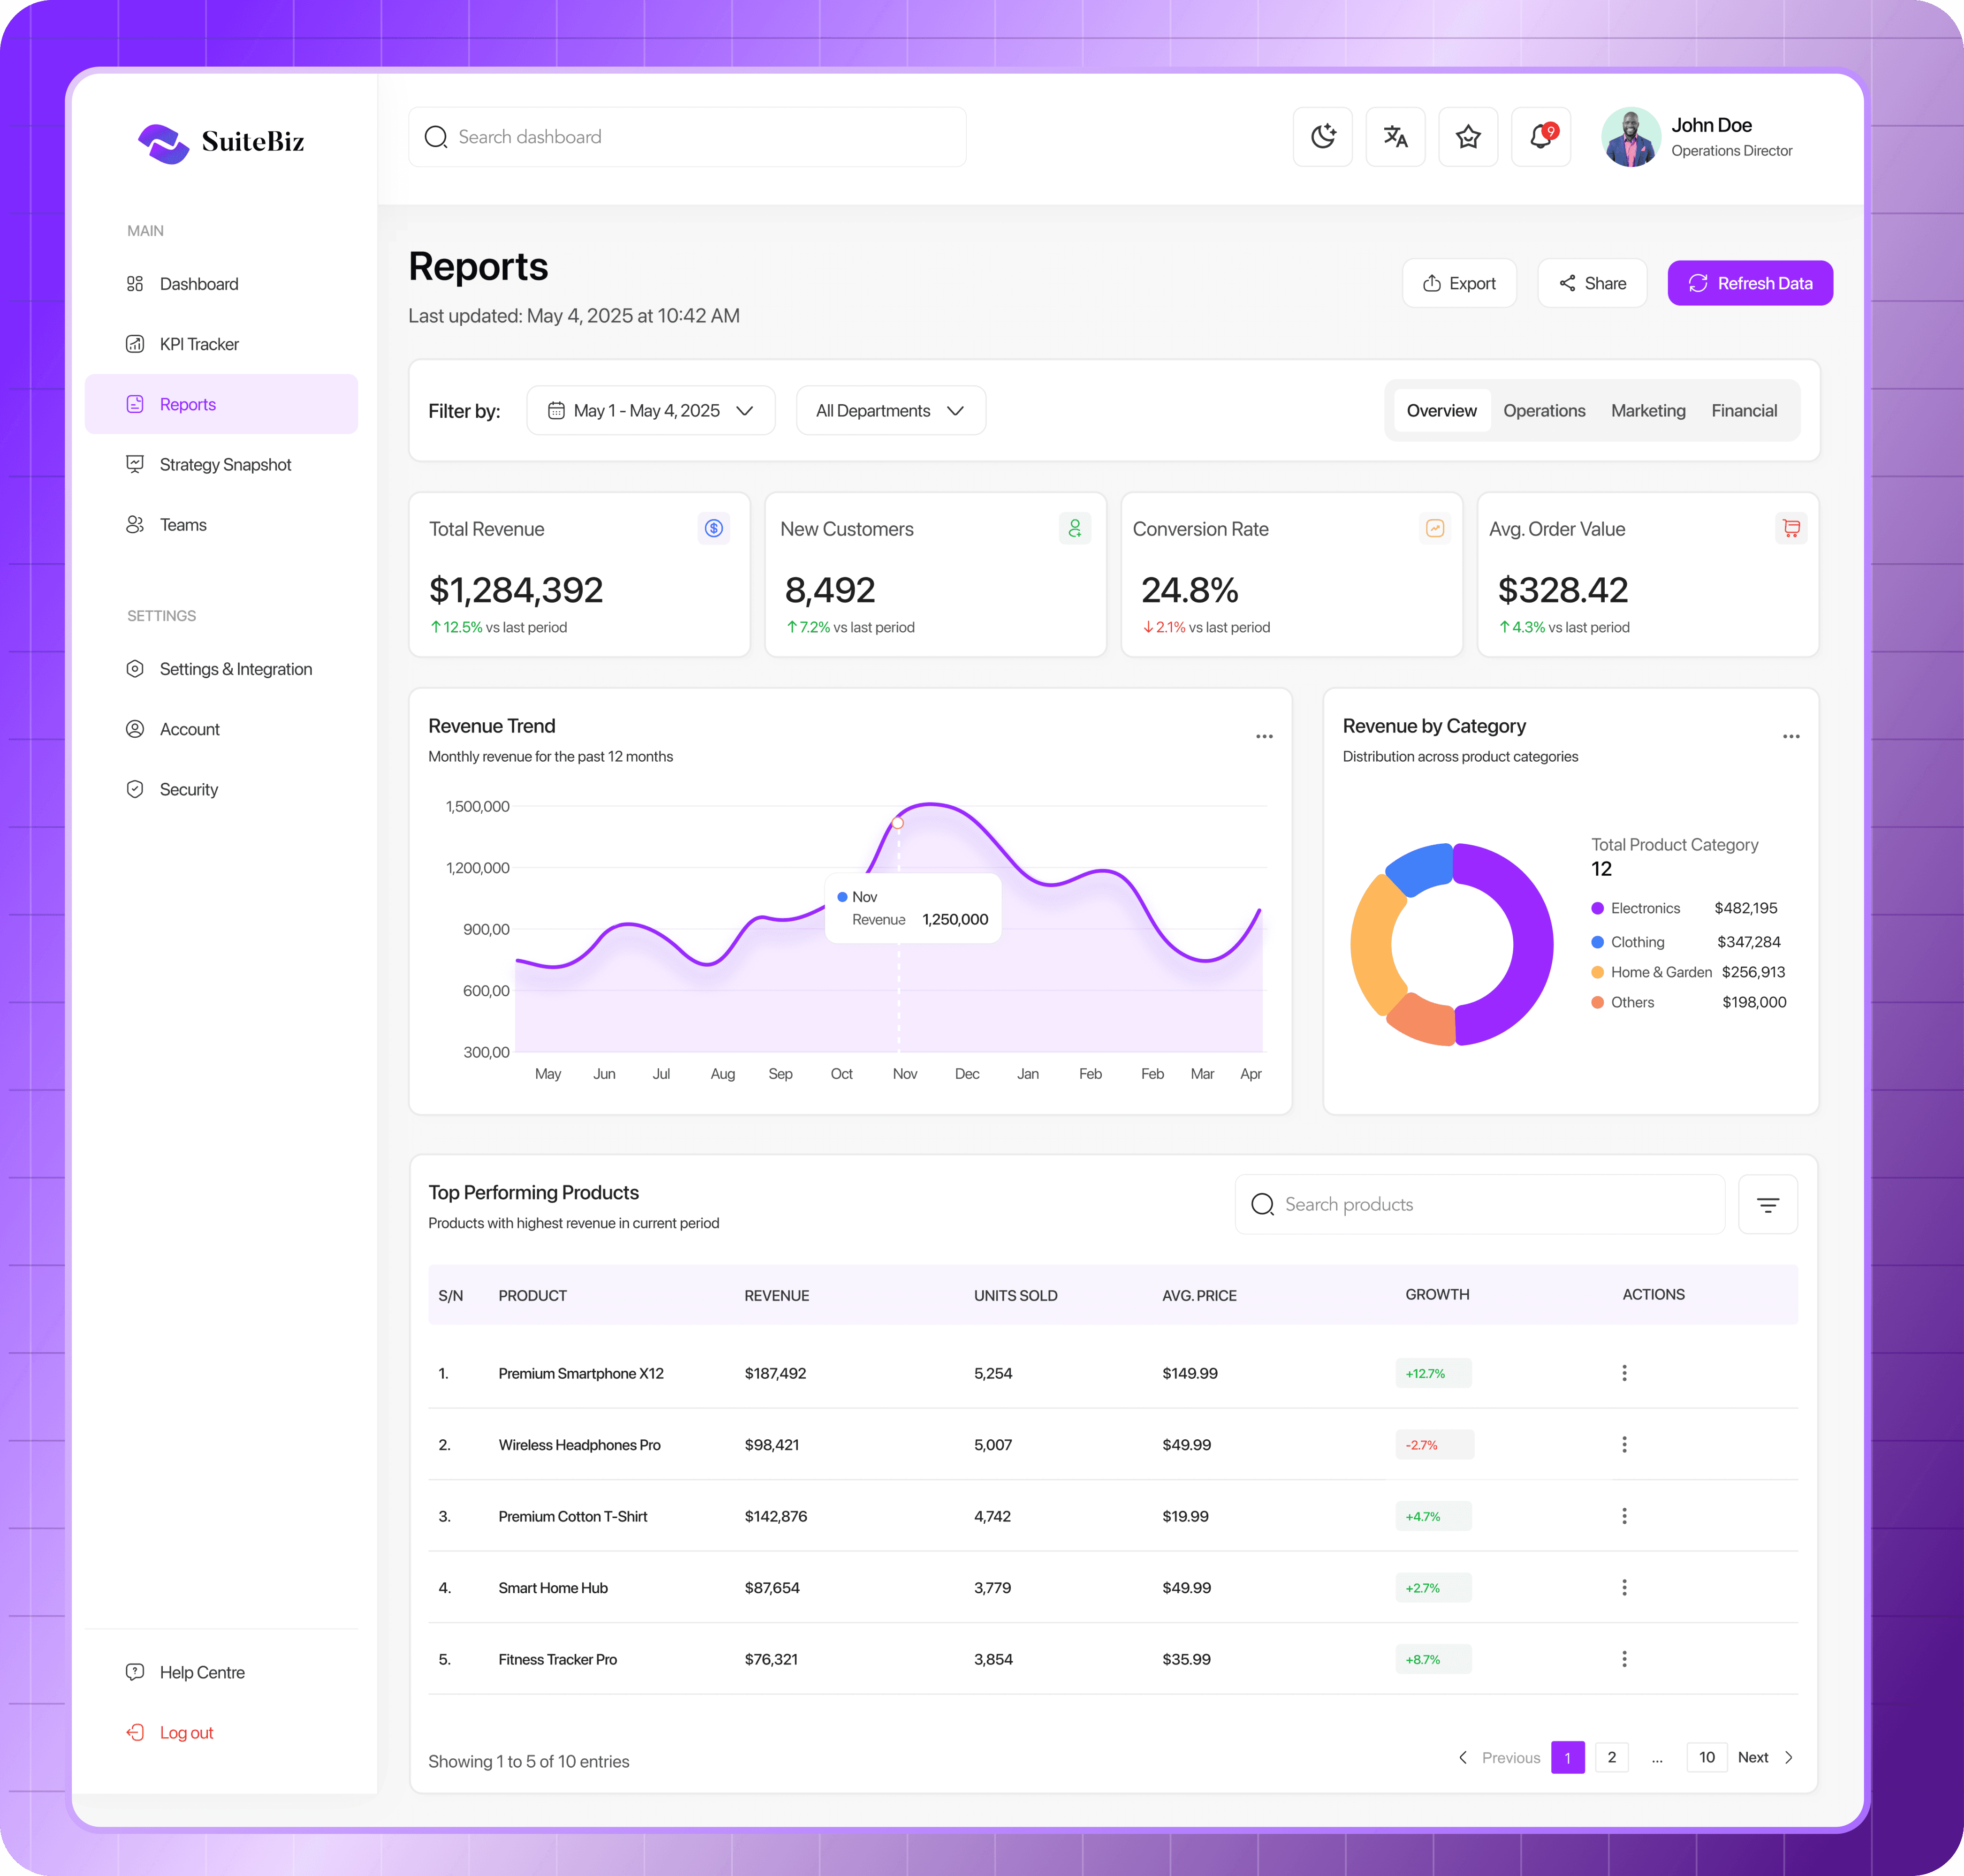
Reports & Analytics
Reports & Analytics
What it does:
Visual quarterly view comparing actual progress vs strategic goals. Uses charts and milestone markers to show alignment or deviation.
User Value:
Gives leadership a bird’s-eye view of whether their teams are on pace to meet long-term objectives.
Outcome:
Keeps executives focused on results, not just daily operations — which supports consistent growth and investor confidence.
What it does:
Visual quarterly view comparing actual progress vs strategic goals. Uses charts and milestone markers to show alignment or deviation.
User Value:
Gives leadership a bird’s-eye view of whether their teams are on pace to meet long-term objectives.
Outcome:
Keeps executives focused on results, not just daily operations — which supports consistent growth and investor confidence.
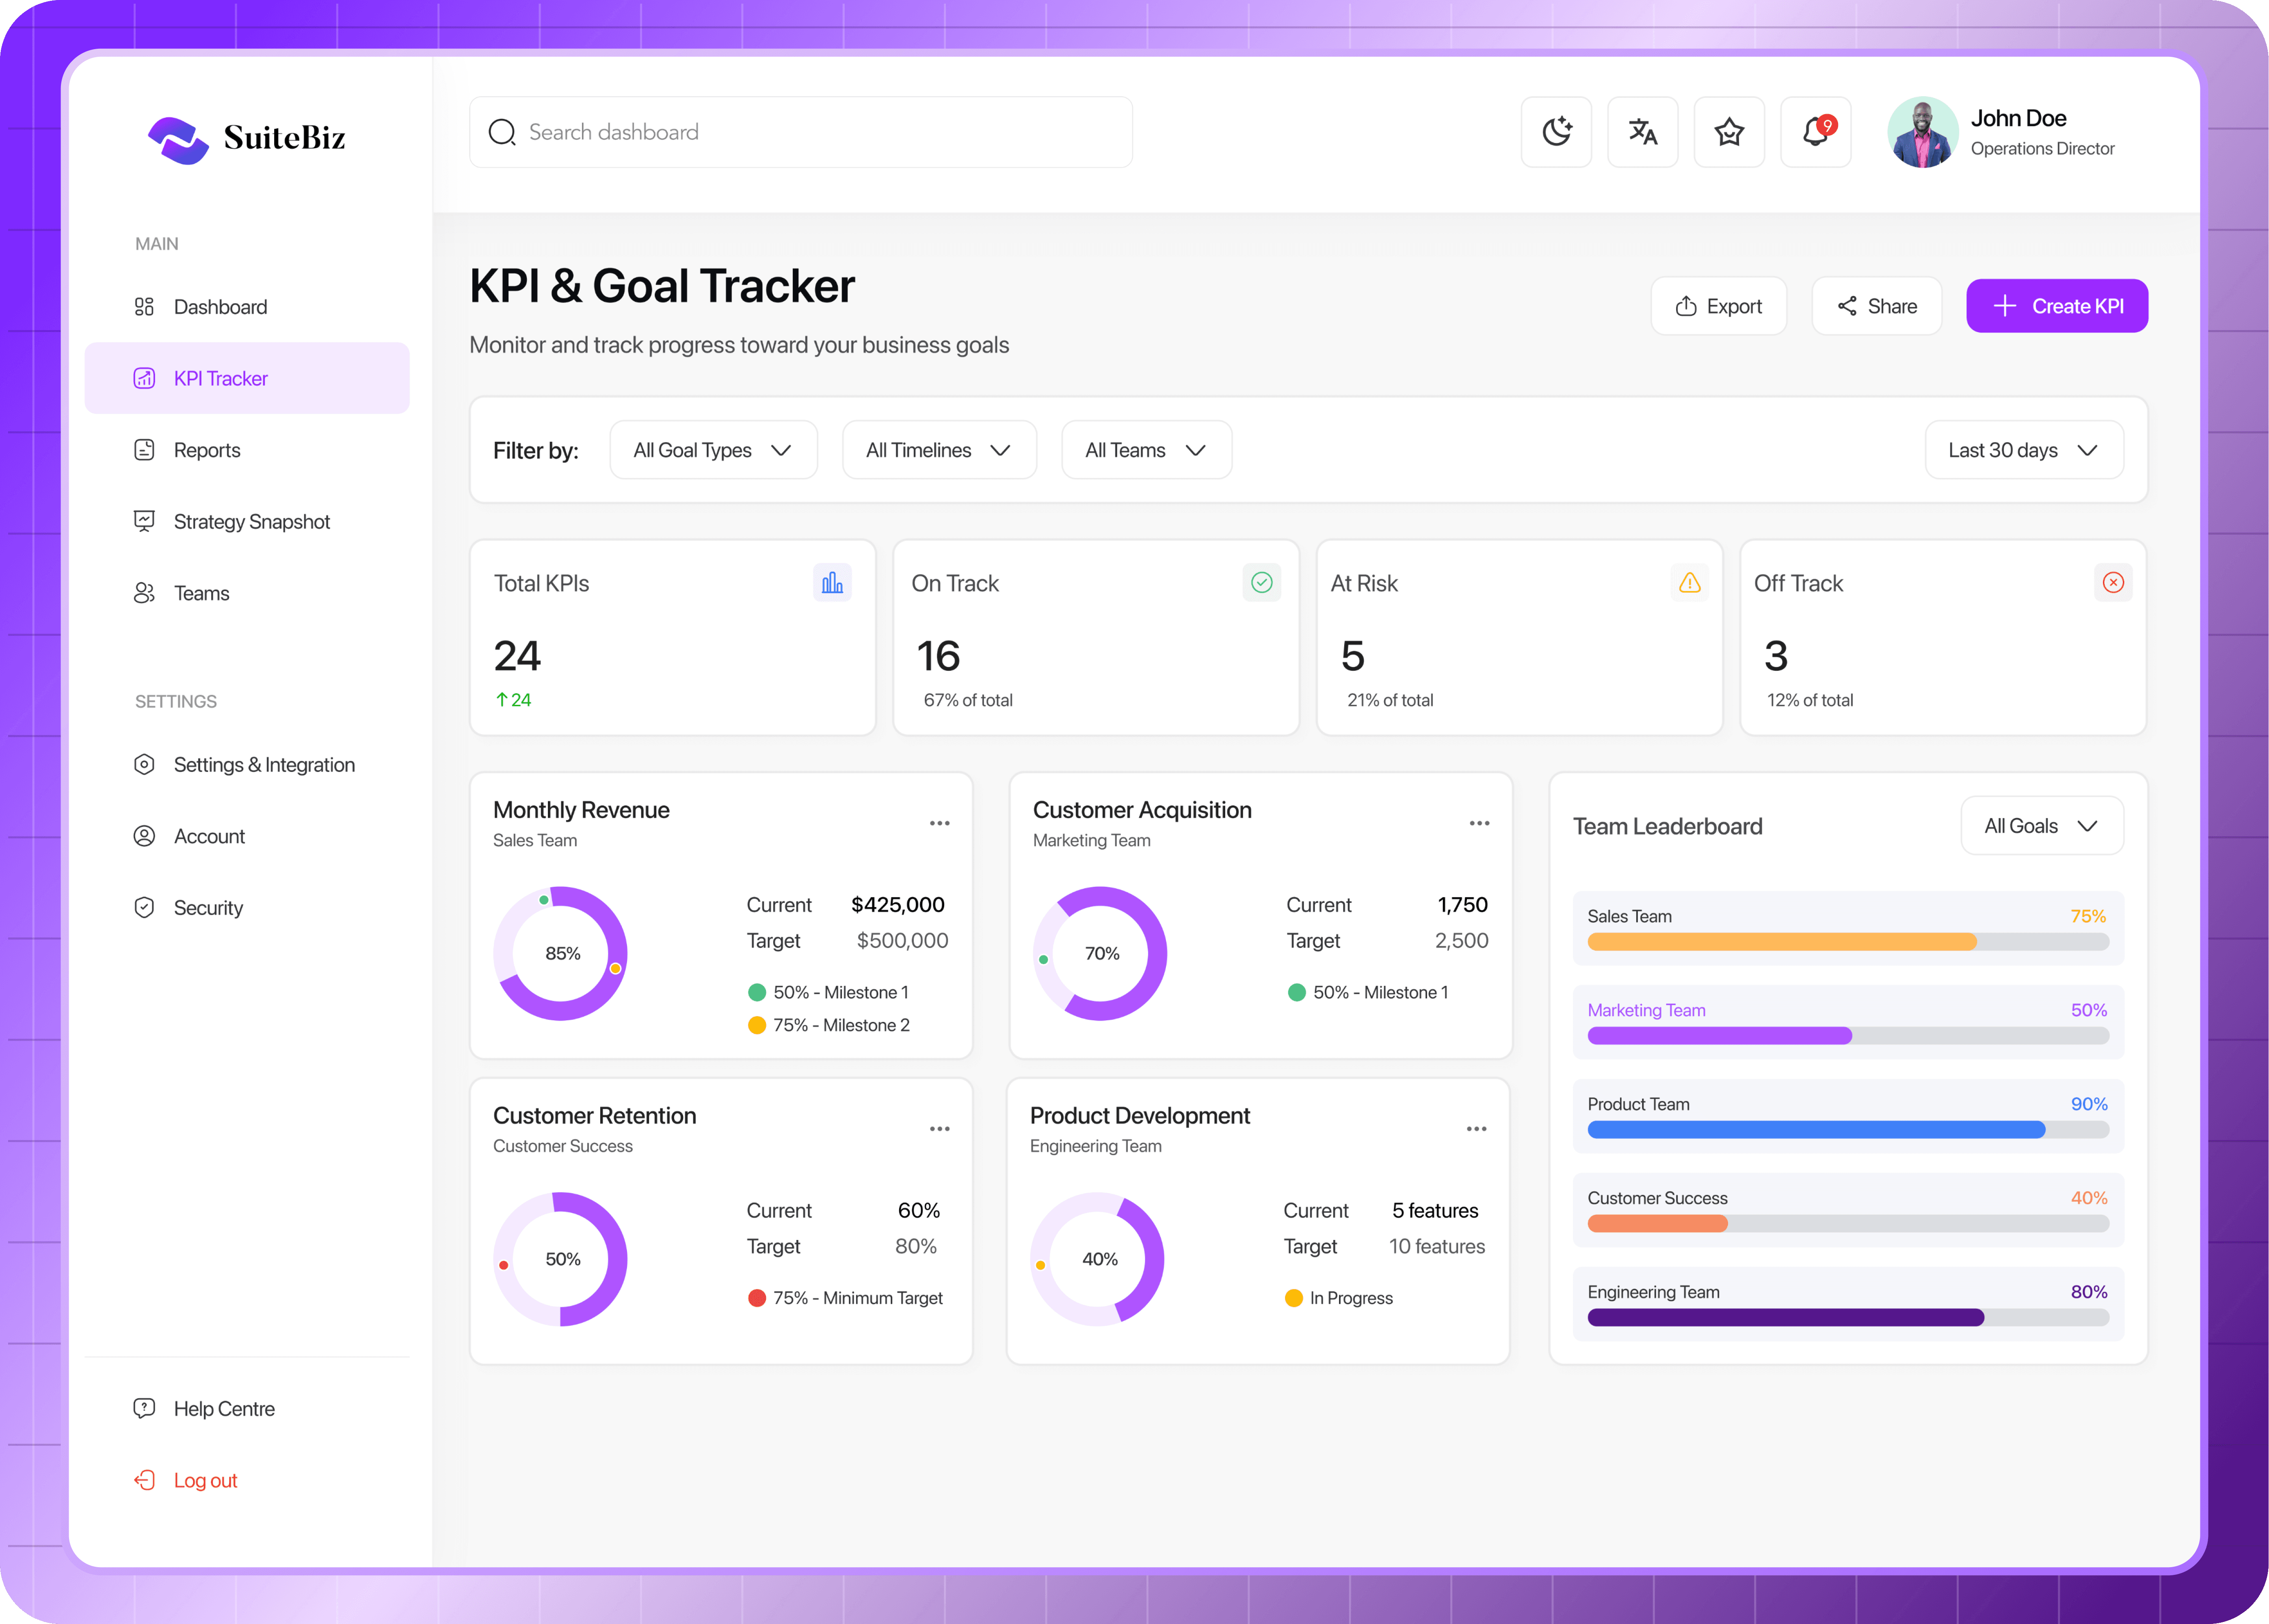
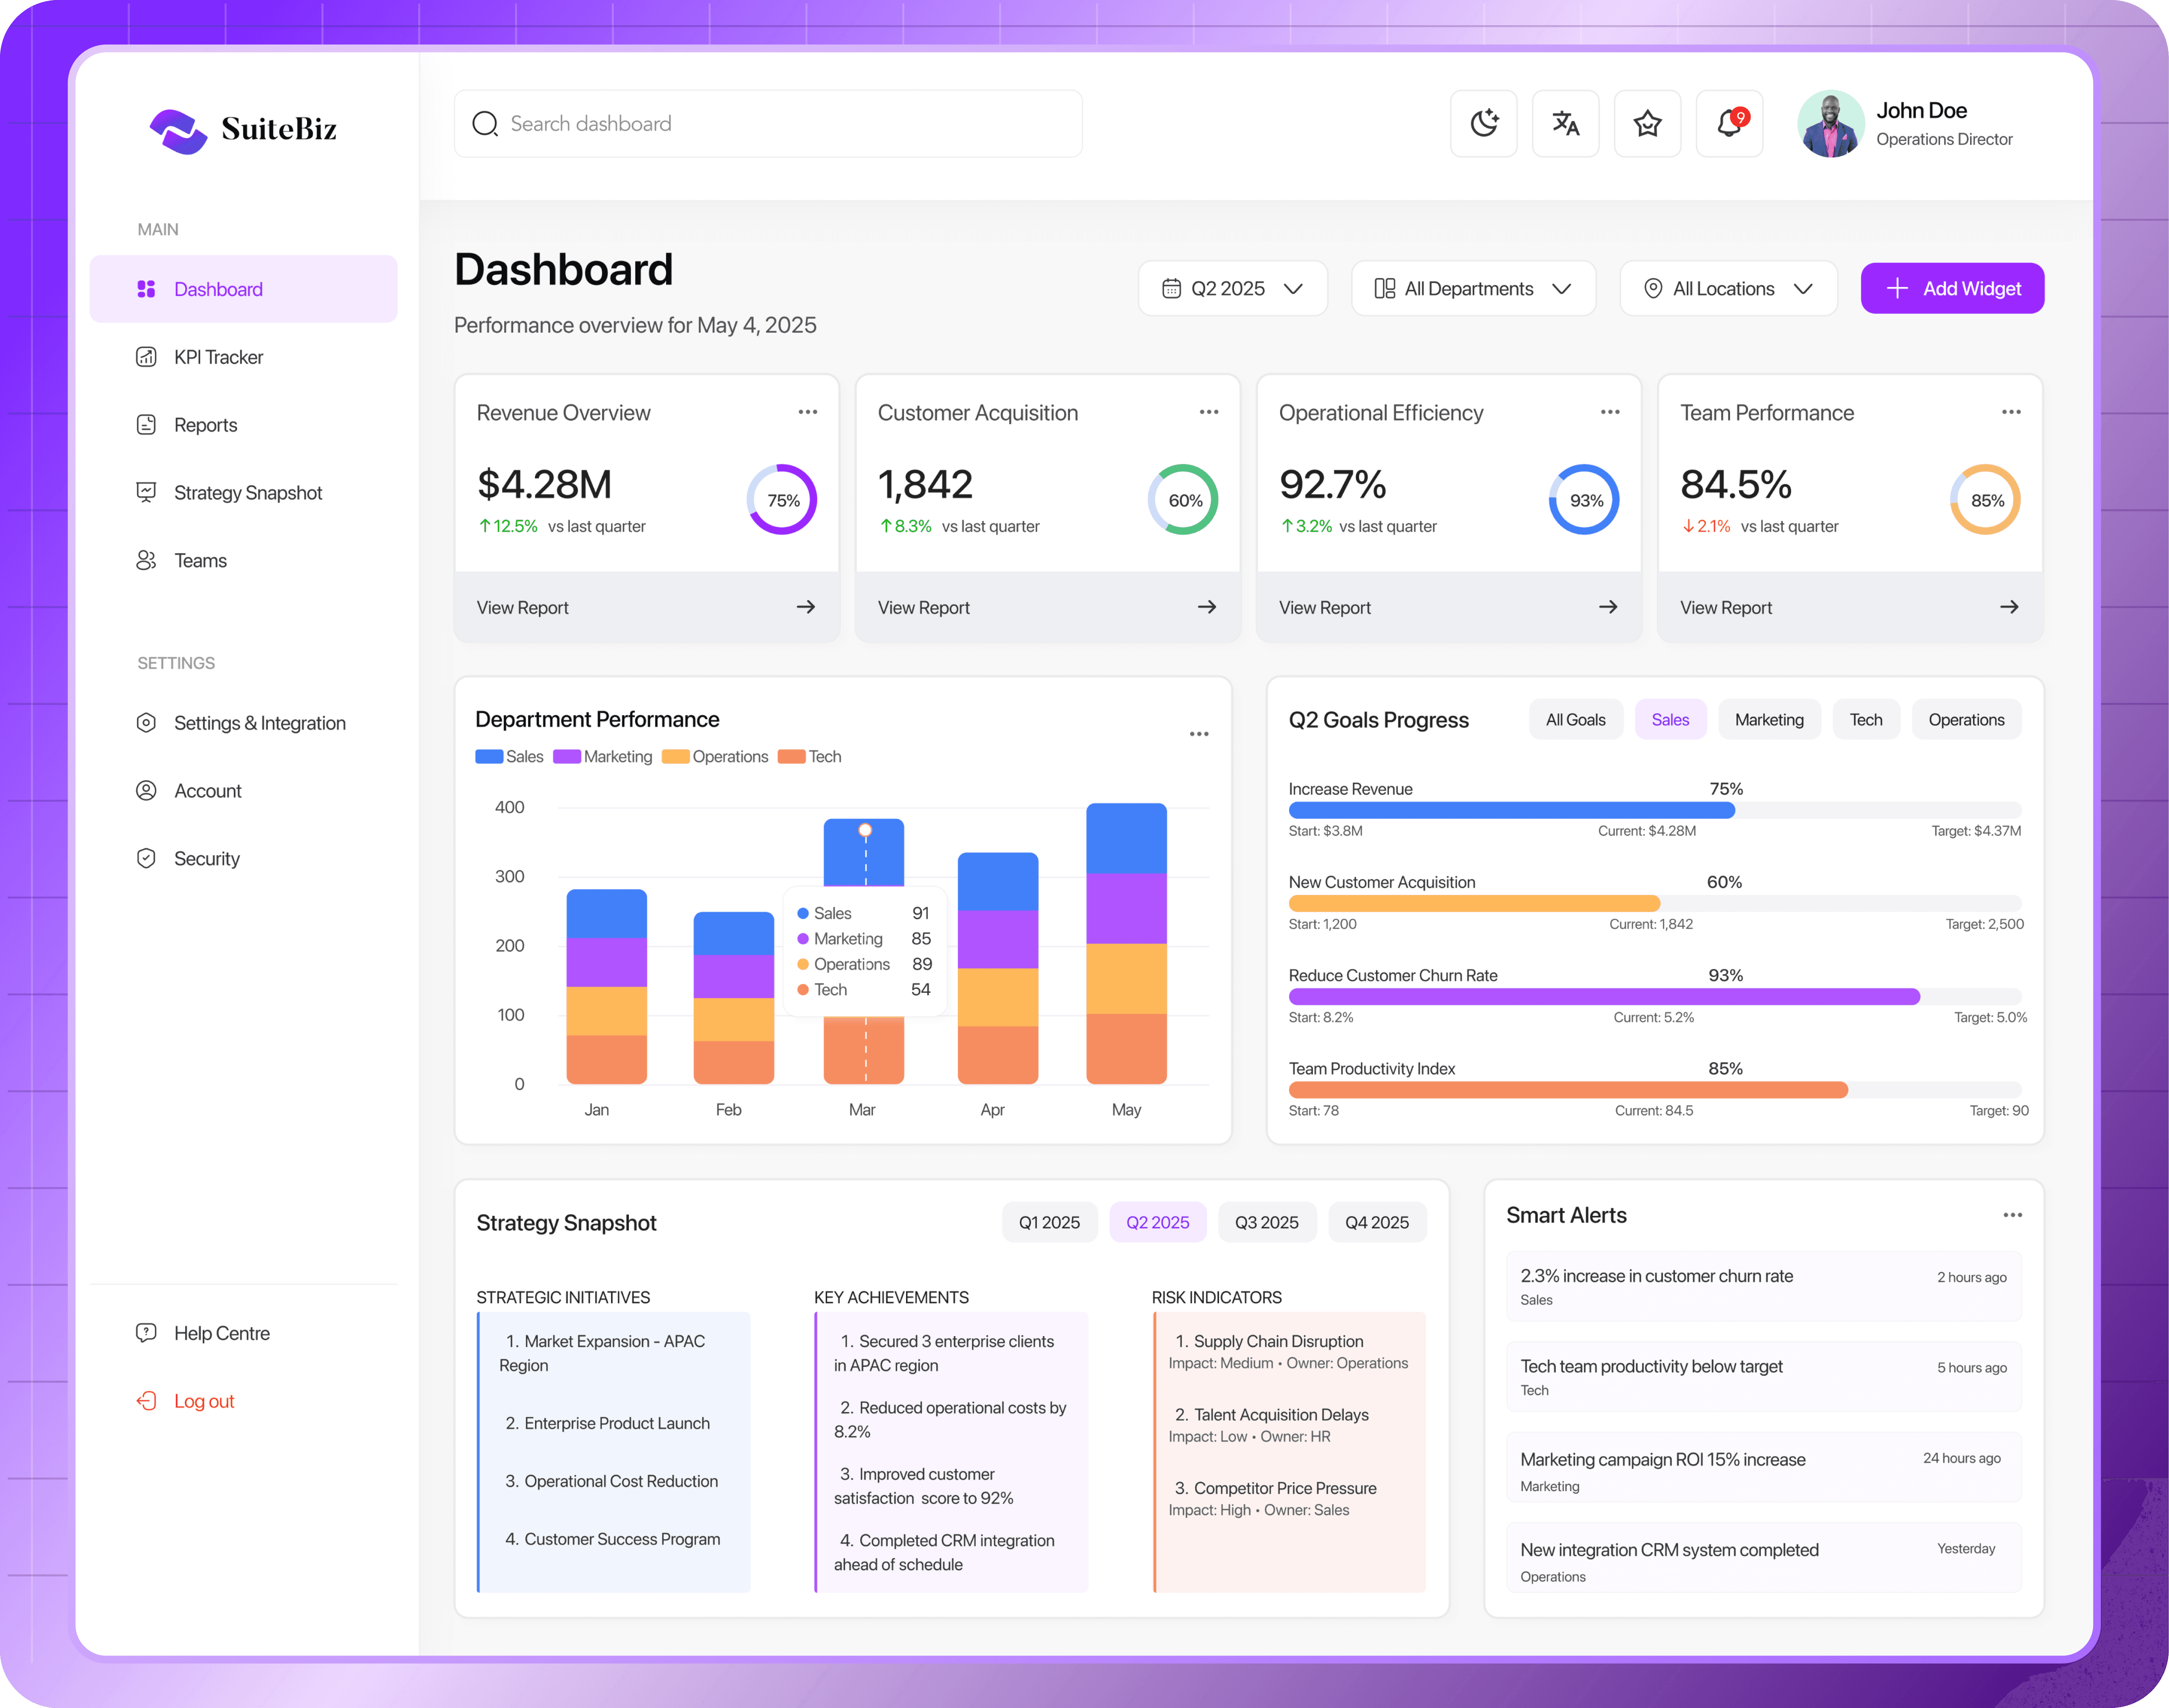
KPI Goal Tracker
KPI Goal Tracker
What it does:
Allows managers to set, assign, and monitor custom KPIs using performance rings, flags, and leaderboards.
User Value:
Promotes ownership of goals across departments and highlights progress or stagnation in real-time.
Outcome:
Drives team accountability and performance through measurable outcomes.
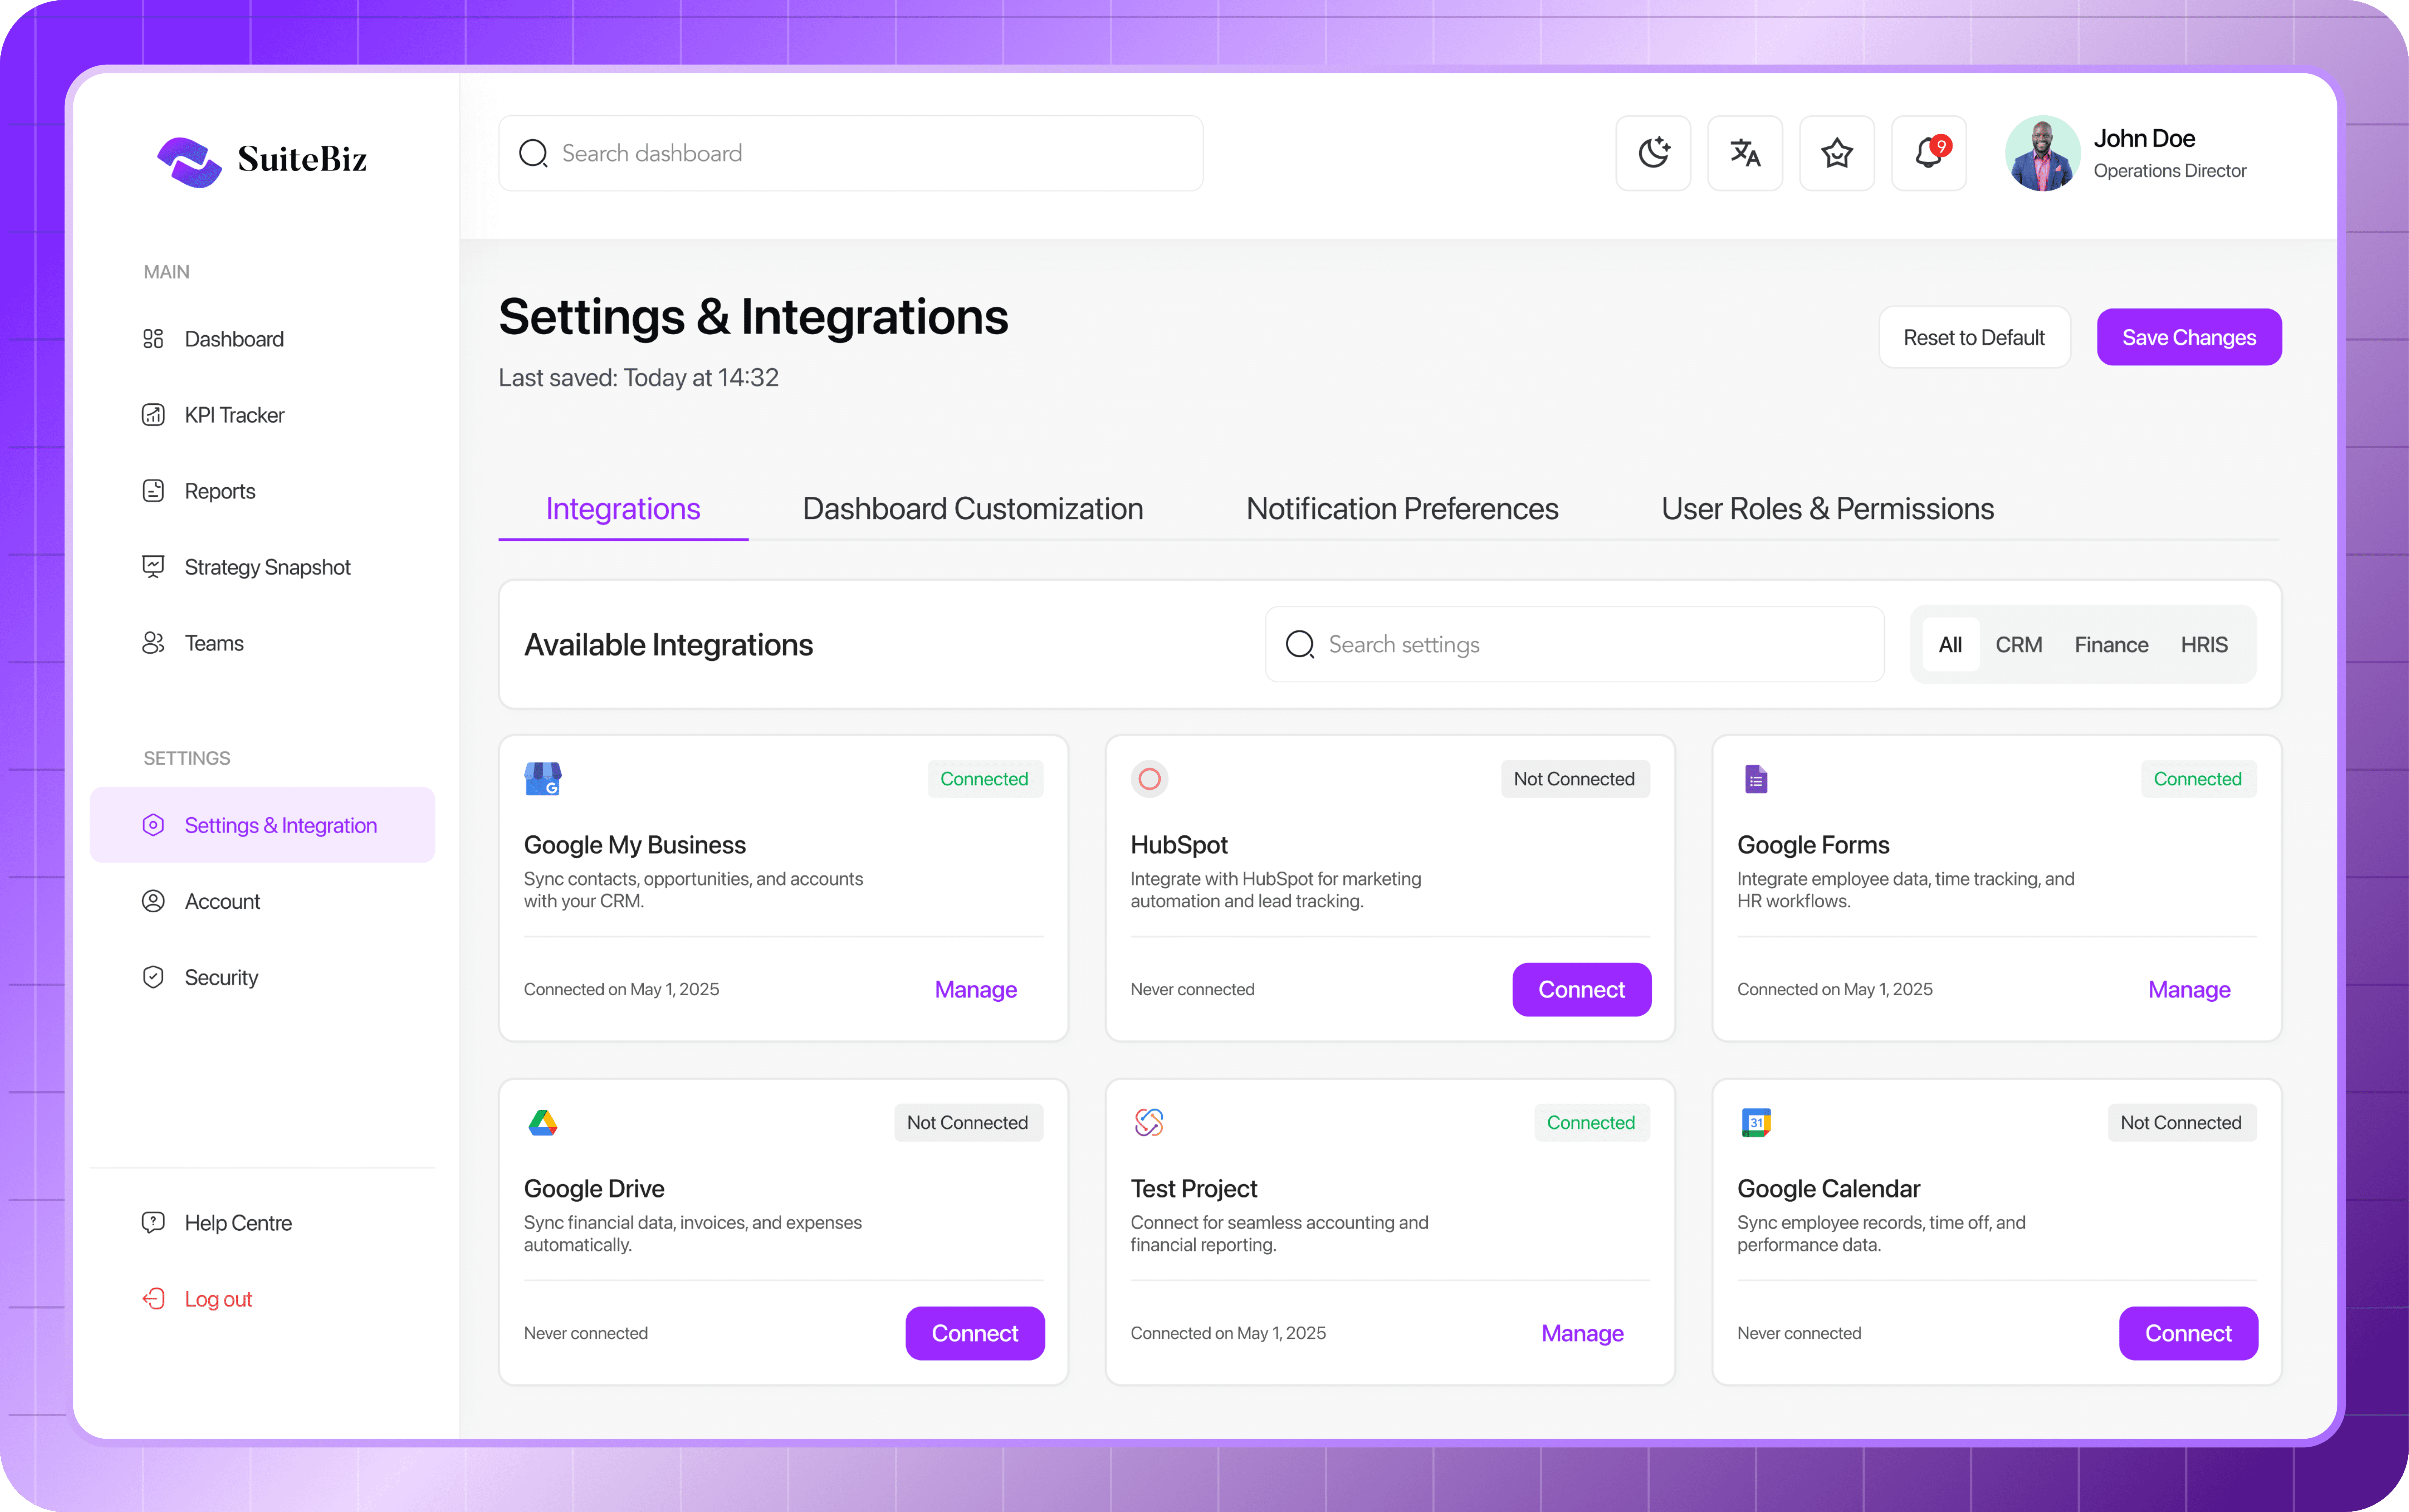
Settings & Integrations
Settings & Integrations
Lets users customize notification settings, connect third-party tools (CRMs, HRMS, finance apps), and set up data sync preferences.
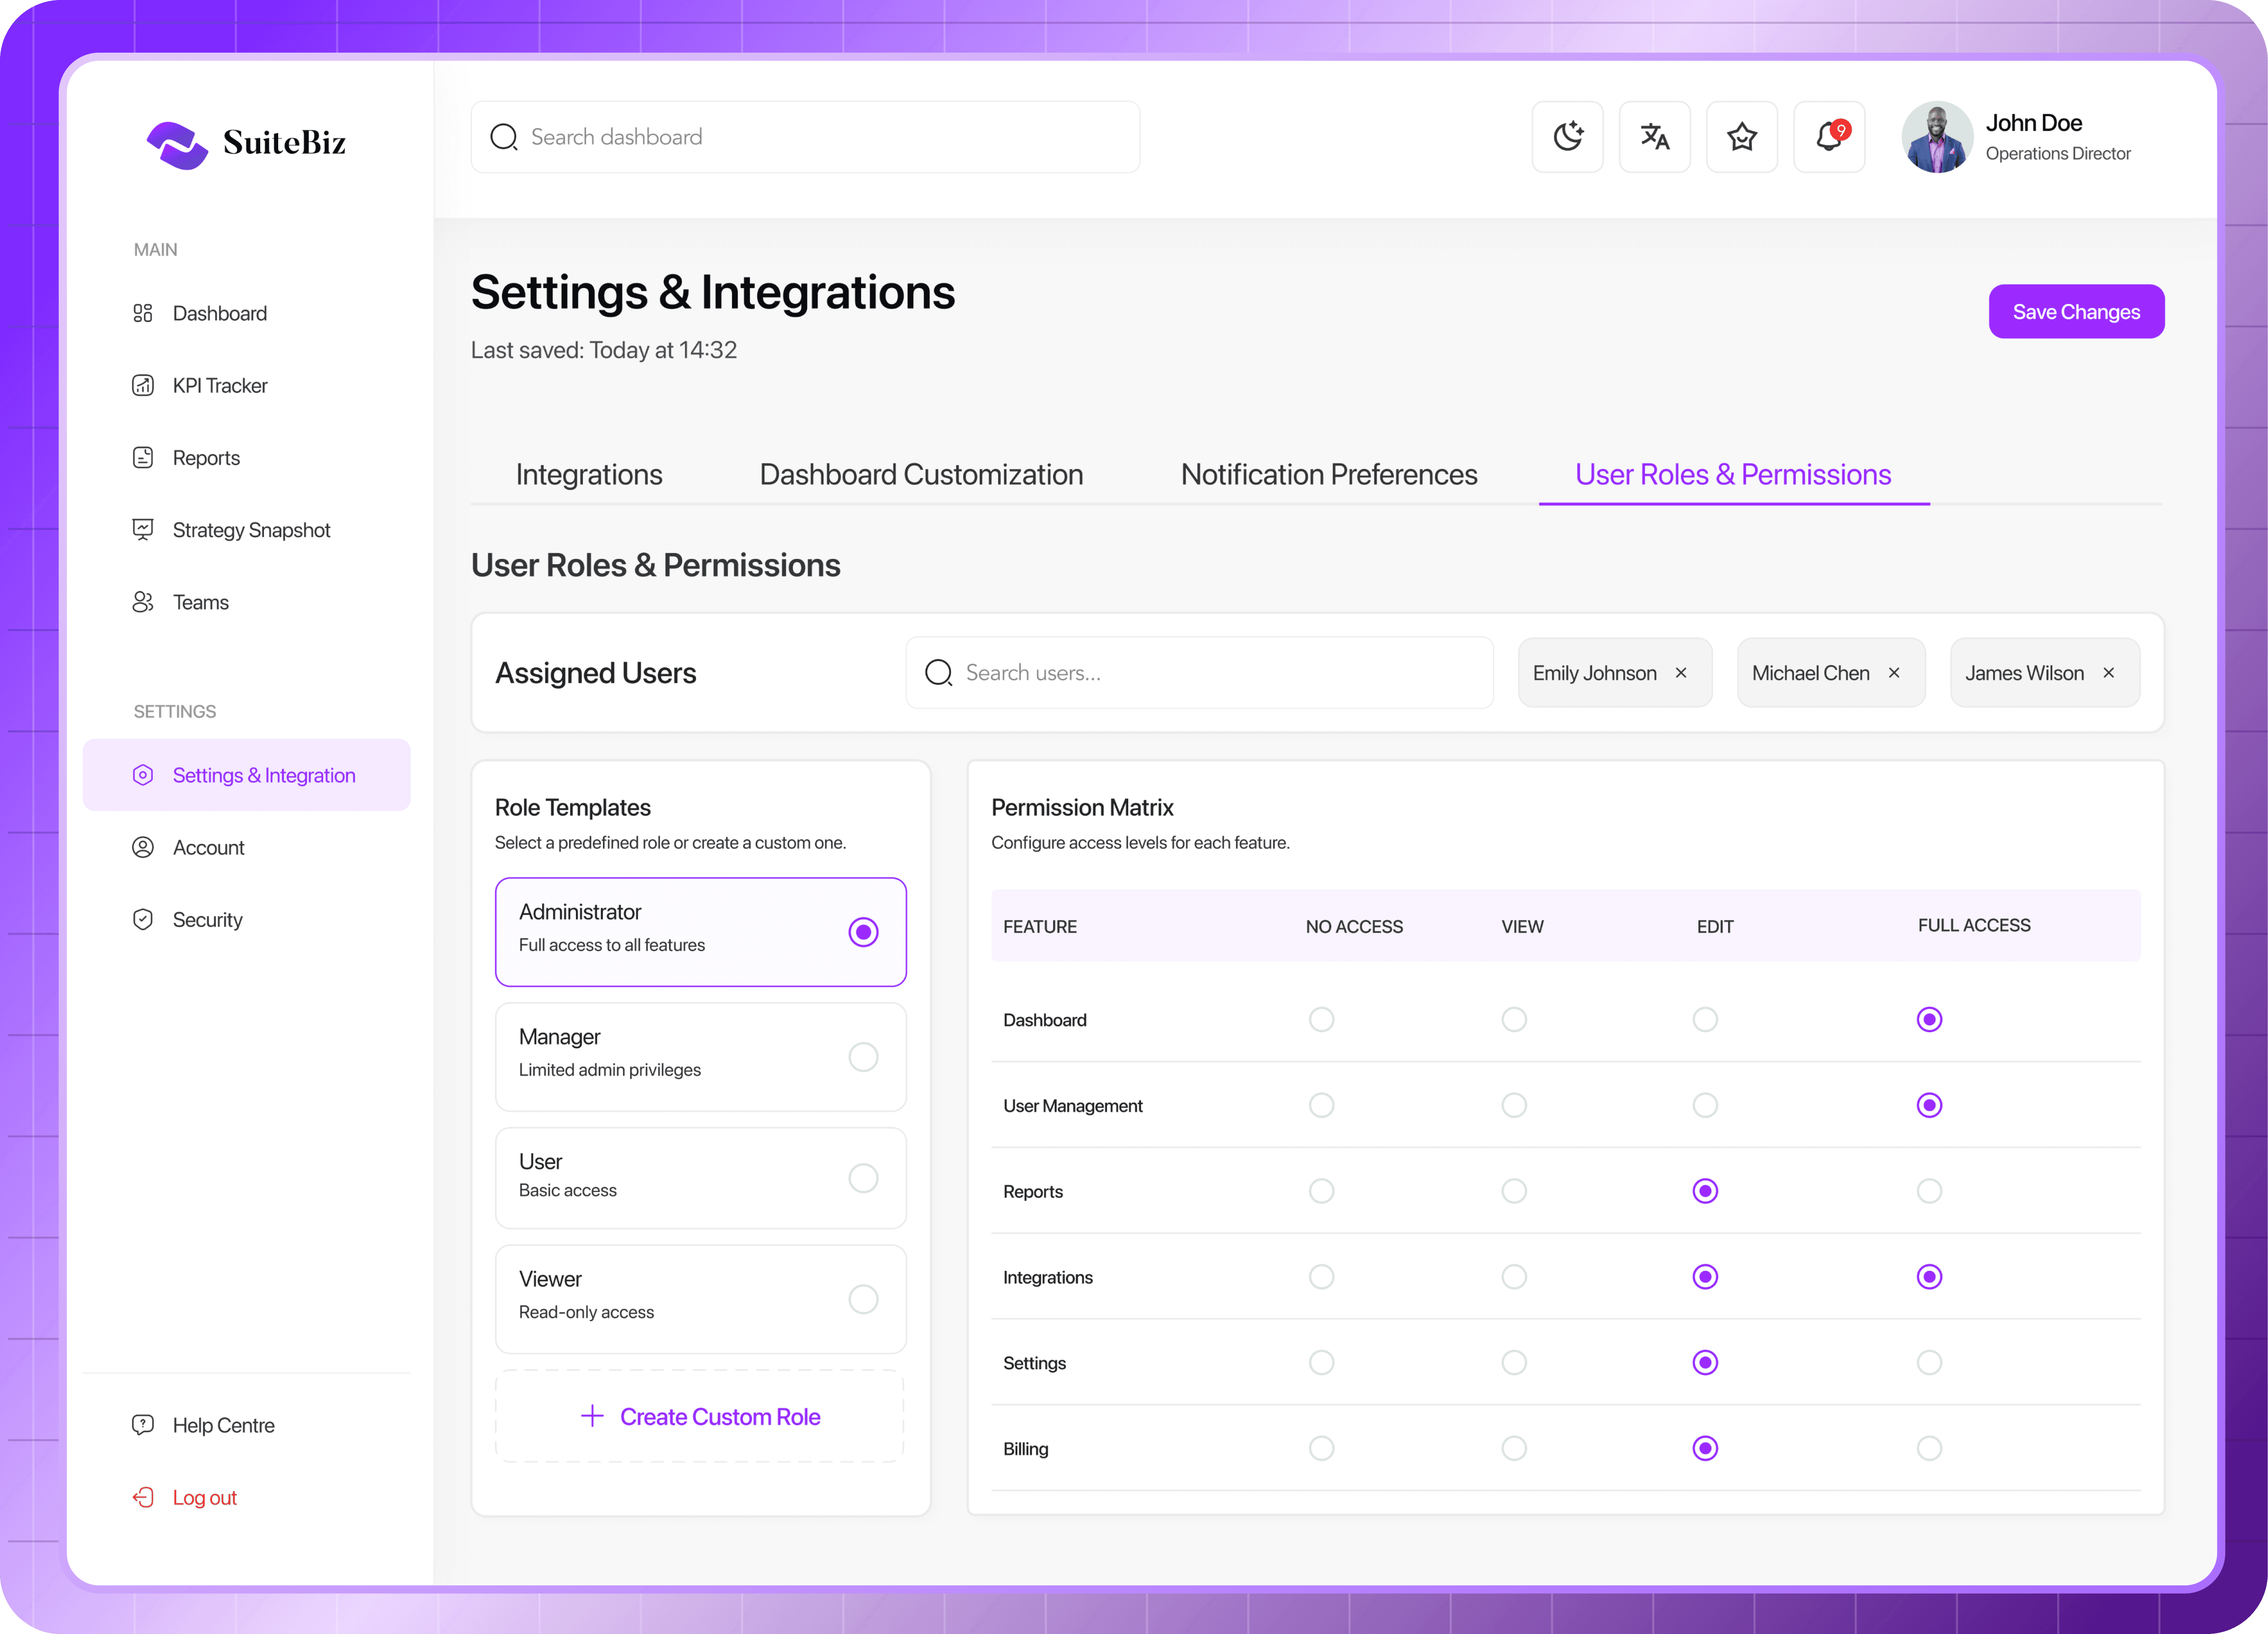
Roles & Permissions: assigns access levels (e.g. admin, team lead, analyst) to control who can view, edit, or manage different parts of the platform.
User Value:
Flexible control over how and where data flows into the system — reducing friction and manual entry.
Outcome:
Boosts productivity and ensures consistent data accuracy across platforms.
Lets users customize notification settings, connect third-party tools (CRMs, HRMS, finance apps), and set up data sync preferences.
Roles & Permissions: assigns access levels (e.g. admin, team lead, analyst) to control who can view, edit, or manage different parts of the platform.
User Value:
Flexible control over how and where data flows into the system — reducing friction and manual entry.
Outcome:
Boosts productivity and ensures consistent data accuracy across platforms.
What This Project Showcases
What This Project Showcases
✔️ My ability to balance data-heavy interfaces with intuitive usability
✔️ Experience designing enterprise SaaS platforms
✔️ Clear link between design decisions and real business impact
✔️ My ability to balance data-heavy interfaces with intuitive usability
✔️ Experience designing enterprise SaaS platforms
✔️ Clear link between design decisions and real business impact
What I learned
What I learned
SAAS/B2B Dashboard platform and enterprise analytics are usually considered as an application involving a huge volume of data and calculations. When I started the process, it looked very complex, later I learned, collaborated, elevated myself throughout and now I have learned how to interpret large business data set and solve scalable problems.
SAAS/B2B Dashboard platform and enterprise analytics are usually considered as an application involving a huge volume of data and calculations. When I started the process, it looked very complex, later I learned, collaborated, elevated myself throughout and now I have learned how to interpret large business data set and solve scalable problems.